LVDC Flowchart Editor Tutorial
History
Contents
Introduction
If you're reading this, I assume you know what the LVDC was, know what
the flight software for it is, and that you have access to the
available LVDC flight-program source code in compliance with
whatever ITAR restrictions on export of that software from the
U.S. may or may not be, so I won't rehash that territory here.
Rather, this page is solely about the creation and maintenance of
software flowcharts based LVDC flight-program software. By
that, I do not mean creation of flowcharts that allow
complete and accurate recreation of the flight-program
software. Instead, I refer to a set of undocumented
annotations that appear in AS-512 and AS-513 flight-program
software (and presumably other versions of the flight software not
available to us) that I theorize may have been hints for
draftsmen creating mid-level flowcharts that could provide
convenient guidance to someone trying to understand the general
flow of the software.
In fact, this is entirely my own idea: There is no
available evidence at all about who created the annotations I
refer to, when they were created, why they were created, whether
they actually relate to flowcharting, how to interpret the
annotations, nor whether flowcharts created from them provide a
reasonably-accurate view of the software flow that could be useful
to someone or not. I merely observe that flowcharts can
be created based on these annotations, that those flowcharts are
pleasing to me, and that perhaps that they are not
entirely without merit more generally.
But they are not perfect. The two main problems about the
flowcharts that bother me are:
- The LVDC software's flowchart-related annotations — if that's
what they are! — are neither fully complete nor fully
correct. Therefore, manual corrections to the annotations
are sometimes useful in producing more-informative flowcharts.
- We don't know if the flowcharts we produce are actually good
reflections of the software source code or not. Perhaps
they're misleading! They need to be checked and corrected
if they do turn out to mislead.
Potentially, the latter of these problems may ultimately require
updates to the flowchart-generation software (more about that in a
moment) But regardless, the first step for either of the
problems is human inspection of the flowcharts and of their
relationship to the LVDC source code, along with manual editing of
the flowcharting annotations as necessary. Both are
difficult tasks, but are the kinds of tasks that can be rewarding
in terms of the understanding gained of the LVDC software in the
process. This tutorial is addressed to someone who would
want to involve themself in process of checking and improving the
LVDC flowcharts.
Preparation
You will need to have access to the transcribed LVDC source code for
whatever software version(s) you're working with. I hope that
eventually this source code can be made generally available, but as
of this writing it is being treated as if it is restricted from U.S.
export by ITAR. If you are qualified to do so, for example by
being a U.S. citizen, follow whatever instructions are given on the LVDC web page for
obtaining access. If the source code is truly
restricted by ITAR, legally rather than by some whim of a
functionary who doesn't care to look into the matter, and if it
continues to be so-restricted, realize that if you do "export" it by
giving it to a non-qualified individual or by posting it online, it
is you have violated ITAR and you who will be legally responsible
for those actions.
As far as the flowcharts themselves are concerned, you don't
actually need copies of them since you'll have the capability of
building them yourself. With that said .... Unlike the
LVDC source code, I do not believe that the flowcharts are
restricted by ITAR, and so it's possible you may find them on the
LVDC web page. However, at least at first, I am continuing
to treat them as ITAR-restricted, so it may be that the only place
you'll find them is the same place you got the LVDC source code.
Having downloaded the LVDC source code and (optionally) the
flowcharts onto your computer, you'll have encrypted archives in
the 7z format, respectively LVDC-software.git.7z and (optionally)
dots.7z. You'll need 7z-enabled archiving software to unpack
these archives. Google it to find out what the right
archiving software is for you platform.
The unpacked LVDC software is in the form of a git repository, so
to access it you'll need to have git installed on your
computer. The unpacked git repository will be called
LVDC-software.git, and won't appear to have any usable files in
it. You'll need to run the command
git clone LVDC-software.git
thus creating a new folder (called just LVDC-software) in which
you'll be able to find all of the LVDC source-code files.
You will need to have Python 3 installed on your computer in
order to run the flowchart-generation software. I don't
believe that any nonstandard Python modules need to be separately
installed. Python 2 will not suffice.
My
flowchart-generation software needs to be downloaded.
The only files actually needed are yaASMflowchart2.py and
sdl.ps. No installation is needed, though you may find it
helpful to give yaASMflowchart2.py "executable" permissions (if
that's something that exists in your operating system) and to put
it in your PATH. The easiest thing to do with sdl.ps is to
put it directly in whatever folders hold LVDC source-code files
(*.lvdc).
The graph-visualization software graphviz is
needed. This is a free download (Linux/Windows/Mac).
(Optional.) In viewing or editing LVDC source code, it is
helpful though not required for the viewing/editing software to be
able to provide syntax highlighting for LVDC assembly
language. You'll see examples of that below. The only
editor presently having LVDC syntax-highlighting capability is vim,
which is admittedly not to everyone's taste.
| Aside: If you do
choose to install vim, LVDC syntax highlighting is not a
standard feature and must be installed separately as a
one-time setup. To do so, download this zipfile and
uncompress it. In the uncompressed folder you'll
find two other folders, named "ftdetect" and
"syntax". There's some folder on your system that
holds vim syntax-highlighting options, though
unfortunately I don't know what it is and you'll have to
google it to find out. On my own Linux system, that
folder happens to be ~/.vim/, though it didn't exist at
first and I had to create it myself. At any rate,
once you figure out the folder you're supposed to use,
and/or you create it, then you should copy ftdetect and
syntax into it. From now on, whenever you open an
LVDC source-code file with vim, it will be
syntax-highlighted. |
(Optional.) The flowcharts are produced in PostScript
format. To view them, you either need document-viewer
software that supports PostScript, or else graphics software that
can conveniently convert PostScript to some other image format,
preferably PNG. There are so many possibilities on so many
different platforms (Linux vs Windows vs Mac) that it is hard to
make solid recommendations. With that said, I most-often use
ImageMagick
graphics software when converting to PNG, and instructions I
give will be geared towards it. Personally, I seldom have
reason to perform such conversions.
Aside: At this
writing, ImageMagick 6 and ImageMagick 7 are both
generally available, with ImageMagick 6 being the
most-readily available on my computer system. At
least on my computer (Linux Mint 21), ImageMagick 6 is
constrained by various "policy" settings, and (for me) the
default policy settings were heavily weighted against my
being able to actually perform flowchart
conversions. So before doing anything at all, I
needed to change the policy settings. I don't know
if ImageMagick 7 has equivalent policy problems. Perhaps
not. I didn't need to change any myself.
ImageMagick 6 policy settings are found in a
file called policy.xml stored somewhere on your
computer. (On my system, they're at
/etc/ImageMagick-6/policy.xml.) The file may require
administrative rights to edit. Fortunately, these
policy changes are a one-time-only thing, and once set
they can be forgotten. On my system, the default
policy settings disallowed all operations using
ghostscript, thus disallowing operations on PostScript
files, so I had to comment out the policy reading
<policy domain="coder"
rights="none" pattern="PS" />
Then too, there are various policies
representing limits on the amount of computer resources
ImageMagick is allowed to use. Any operation that
exceeds those limits will fail, probably with unhelpful
messages that do not allow you to isolate the
problem. Unfortunately, on my own system, I've had
to pep up these limits quite a lot, long ago, for
applications unrelated to flowcharting, so I have little
idea how much you'll have to change the limits;
probably less drastically than me. The
resource-related policies that may require pepping
up on your system currently read as follows on my system:
<policy domain="resource"
name="memory" value="24GiB"/>
<policy domain="resource" name="map"
value="1GiB"/>
<policy domain="resource" name="width"
value="32KP"/>
<policy domain="resource" name="height"
value="32KP"/>
<policy domain="resource" name="area"
value="256MP"/>
<policy domain="resource" name="disk"
value="2GiB"/>
But the only resource policies I've set
specifically for flowchart-conversion reasons are the
"width" and "height" settings.
|
How to Build an LVDC Flowchart from
Source Code
Creation of software flowcharts from LVDC source-code files is a
multistep process, which in general looks like this:
- Conversion of LVDC source-code files (*.lvdc) to flowcharts in
the
DOT graph-description language is carried out by the
program yaASMflowchart2.py.
- Conversion of DOT files to flowcharts in the PostScript
page-description language is performed by the program
called "dot" that is provided by your installation of graphviz.
- (Optionally) PostScript files are converted to other viewing
formats (PNG, JPG, PDF, etc.) by graphics software such as
ImageMagic, GIMP, maybe Adobe Acrobat, maybe Photoshop, etc.,
though in general it's just easier to view the PostScript files
directly in appropriate viewing software.
Let's consider these steps in order.
Creation of DOT files from LVDC files. Recall that
any given LVDC flight program consists of a set of dozens of LVDC
source-code files. We don't create a single, immense
flowchart for an LVDC flight program as a whole. Rather, the
flowcharting annotations in the LVDC software define many, many
smaller flowcharts. Usually there's a single flowchart in an
individual LVDC source file. But sometimes there are
multiple flowcharts in a single source file, and sometimes (though
rarely) there are none at all. The naming of the flowchart
files is provided by the flowcharting annotations and not
by the filenames of the source-code files. You can either
process each source-code file individually, or else you can
concatenate some or all of them and process them all at
once. If yaASMflowchart2.py is in your PATH, from a command
line you could process a single LVDC source-code file (say,
SQUARE_ROOT_UTILITY.lvdc) like so:
yaASMflowchart2.py <SQUARE_ROOT_UTILITY.lvdc
Or in Linux, you could process all of the LVDC files in the
current folder at once like this:
cat *.lvdc | yaASMflowchart2.py
In Windows, the corresponding command would be:
type *.lvdc | yaASMflowchart2.py
The result of this operation is a bunch of DOT files, 93 in all if
you're working with the entire set of AS-512 source-code files:
ABSOLUTE-COMMAND_FREEZE_UTILITY_(FR).dot
ACCELEROMETER_PROCESSING_(AP).dot
ACCELEROMETER_READ_(AR).dot
ACQUISITION_GAIN-LOSS_(GL).dot
APS_ATTITUDE_CONTROL_TEST_(AC).dot
ARCTANGENT_UTILITY_(AT).dot
BOOST_NAVIGATION_(NE).dot
CHI_COMPUTATIONS_(CC).dot
CMC_CUTOFF_(CI).dot
COMPRESSED_DATA_TELEMETRY_(CT).dot
...
By the way, these DOT files can themselves be manually edited to
change the appearance of the flowcharts, if you're expert enough in
graphviz and the DOT language to do so. I wouldn't recommend
doing that in general, since any changes you make to the DOT files
directly are so easily overwritten later by yaASMflowchart2.py and
thus lost. But the potential does exist.
Conversion of DOT files to PostScript. Converting a
single DOT file to PostScript format (again, say
SQUARE_ROOT_UTILITY_(SR).dot), looks like this:
dot -l sdl.ps "SQUARE_ROOT_UTILITY_(SR).dot"
>"SQUARE_ROOT_UTILITY_(SR).ps"
On some platforms, the surrounding quotes (single-quotes could be
used instead) aren't needed, but on others the parentheses in the
filename causes problems without the quotes, so you may as well just
always include them.
Note that the file sdl.ps just be either in the current folder, or
else you'll have to provide a full path to where it is actually
located. To make it simple above, I just assumed that it was
in the current folder.
Depending on your platform and what document-viewing software is
installed on it, these *.ps (PostScript) file may now be directly
viewable as flowcharts just by clicking on them with a mouse.
Alas, on other platforms doing that may simply show you the files as
text, which is pretty uninformative. It may be painful, but if
it doesn't work at first, my advice to you would be to research the
available solutions for directly viewing PostScript files on your
system. There will be some free solution, but I simply don't
know that it is for you.
Even on Linux it hasn't always been easy. For example, on my
system, the default document viewer (xreader) displays the
PostScript flowcharts just fine, but cannot zoom very large images
appropriately; an alternate viewer (okular) works terrifically for me,
but when I install okular on Windows it just shows the PostScript
files as text.
Conversion of PostScript to other image formats.
Optionally, you may want to convert the PostScript files to image
files like PNG, JPG, SVG, or PDF. My own advice, if you choose
to do this, is to convert to PNG. The PNG files will be much
smaller than JPG files; and while not as scalable as SVG will be
more easily viewable in more contexts without additional software
installation; and conversion to PDF will likely involve you in
unpleasant discoveries about "paper size" (hint: you need very large
paper sizes sometimes) that you won't have to worry about with PNG.
The two cross-platform methods I've used with success for conversion
are GIMP and ImageMagick.
Neither program directly supports PostScript; rather, each is a
convenience layer using ghostscript
to perform the actual conversion.
GIMP is purely interactive, and is relatively convenient for
converting a single file. If you ask it to load one of your
PostScript files, there will be a pop-up asking you various
questions about the conversion: I'd suggest using a "resolution" of
96, "Color", "Strong" text antialiasing, and "Strong" graphic
antialiasing. Once loaded, you can then use File/Export-as to
output it as a PNG file.
ImageMagick is purely command-line driven, and therefore is more
useful than GIMP for batch conversions. The basic command in
ImageMagick 6 for converting a single file, such as our
SQUARE_ROOT_UTILITY_(SR).ps file, is
convert -density 96 "SQUARE_ROOT_UTILITY_(SR).ps"
-background white -flatten "SQUARE_ROOT_UTILITY_(SR).png"
For ImageMagick 7, the "convert" command absurdly turns instead into
the "magick" command but is otherwise the same:
magick -density 96 "SQUARE_ROOT_UTILITY_(SR).ps"
-background white -flatten "SQUARE_ROOT_UTILITY_(SR).png"
Flowchart Annotations in LVDC Source
Code
As I've mentioned, AS-512 and AS-513 flight-program source code
contains various unexplained annotations among the program
comments that usually have no immediately-obvious interpretation
in terms of describing what the source code is doing. After
contemplating the meaning of these for a couple of months, I
formed an impression that these annotations may have something to
do with flowcharts, and specifically may be hints for creating a
flowchart of the associated code. Or possibly at one time
had even been exact instructions for automating generation of
flowcharts, but had deteriorated over time due to neglect and lack
of programmer training. Whatever the explanation, in AS-512
and AS-513, by my reckoning, the annotations can no longer be
interpreted with 100% reliability. Thus the explanations I'm
going to give you of these annotations and how to interpret (or
edit) them are based on my own inferences, and have lots of
exceptions where they don't agree with my explanations.
Throughout this section, I'll illustrate my explanations using
AS-512's MATRIX MULTIPLY UTILITY module. Here's the entire
original source code for that module, sans and modern comments we
added when transcribing it. Everything that I think is part
of a flowcharting annotation in one way or another has been
highlighted either in red, green, or blue:
$SEGMENT MM
REF
MATRIX MULTIPLY UTILITY (MM)
TITLE
'MATRIX MULTIPLY UTILITY
(MM)
A0840'
**********************************************************************
*
*
*
*
*
MATRIX MULTIPLY UTILITY
(MM)
*J
*
*
*
*
**********************************************************************
*
DATE
5 - 18 - 68
*
REVISIONS NONE
*
FUNCTION
THE FUNCTION OF THE MATRIX MULTIPLY UTILITY MODULE
*
IS TO PERFORM A MATRIX MULTIPLICATION ON THE TWO
*
SPECIFIED MATRICES
*
ENTRIES
U.MM00 - TWO ARGUMENTS SUPPLIED UPON ENTRY. IN AC,
*
A DFW ON THE FORM CLA,A,MPY,B WHERE A AND
*
B ARE THE INITIAL LOCATIONS OF THE
*
MATRICES TO BE MULTIPLIED. IN PQ, A WORD
*
CONTAINING A DFW OF THE FORM STO,C IN
*
SYLLABLE 1 AND A COUNTER (SCALED B25) IN
*
SYLLABLE 0. C IS THE INITIAL LOCATION OF
*
THE PRODUCT MATRIX.
*
LIST
$
* ARROWLEFT DRAW
<
$
* ARROWRIGHTDRAW
>
$
* ARROWDOWN DRAW
V
$
*
SYMBOL DRAW
.
$
ORG P.MOD,C.UT
*Q
*
*
U.MM00
S
U.MM00 STO
777 SAVE RETURN LINKAGES AND INPUT ARGUMENTS
B
SUB
=O01 AKJUST DFW
FOR USE
STO D.VUTB+4
CLA 775
STO D.VUTB
AND =3
STO D.VUTB+5
SAVE COUNTER
CLA 777
STO D.VUTB+6
MM100 HOP
MM500 (U.VD01)FORM
VECTOR DOT
P
EXM
0,1,0 STORE 1ST ELEMENT
B
HOP
MM500 (U.VD01)FORM
VECTOR DOT
P
EXM
0,1,1 STORE 2ND ELEMENT
B
HOP
MM500 (U.VD01)FORM
VECTOR DOT
P
EXM
0,1,2 STORE 3RD ELEMENT
B
CLA D.VUTB+5
SUB =1
TNZ
MM200 MATRIX MULTIPLICAT- ION COMPLETE
N
HOP D.VUTB+6 RETURN
X
*
NONE
8
$
MM200 STO
D.VUTB+5 SET TO
FORM ELEMENTS FOR NEXT ROW
B
CLA D.VUTB+4 *
ADD =O7500004 * RESET
A ADDRESS, INCREMENT B ADDRESS
STO D.VUTB+4 *
CLA D.VUTB
ADD
=O01
* INCREMENT C ADDRESS
STO D.VUTB
TRA
MM100
G
MM500 STO
777 SET TO
PEFORM VECTOR DOT
CLA D.VUTB+4
ADD =O01
STO D.VUTB+4
TRA U.VD01
*
E
*
H
The red annotations are clearly the
most mysterious as they seem to have no purpose whatever in
explicating the code. If present, they are invariably in
column 71. (Recall that LVDC source-code was originally on
80-column punch-cards and has a specific columnar alignment.)
Some of these red markings, in my
view, give you high-level information about a flowchart:
- J indicates the start of a
flowchart. It invariably appears only in full-line
comments, and the remainder of the comment (shown above in blue), minus any * or spaces at the
beginning or end, is the title of the flowchart.
- H indicates the end of a
flowchart. Any source-code lines not between J and H
are not included in any flowchart.
Aside: Other than J and H
lines, I currently just ignore all full-line comments, because I
haven't figured out any reliable interpretation for them.
It's possible they may be best interpreted as captions for
blocks of flowchart elements, and that they should be printed on
the flowchart separately from any individual boxes or
arrows. I just don't know. However, omitting them
doesn't seem to do much harm.
More often, red annotations indicate
that there's a flowchart box associated with the vicinity of that
line of code, and tells you the shape of the box. Only a few
of the many relatively-standardized flowchart shapes are used.
How the captions of the boxes should be derived isn't entirely
clear, and the flowchart-generator program tends to use a
prioritized heuristic approach to figuring it out, as described in
the following table.
Red
Annotation
|
Interpretation
|
Flowchart Shape
|
S,
X, G
|
Entry or exit point. Or
more specifically:
- S: Start point. Caption: If the line
of code has a symbolic label, it uses that symbolic
label; otherwise, if the program comment is of the form
"(label)remainder of comment", it uses
label; otherwise, if
the program comment isn't empty and has no spaces in it,
it just uses the comment in its entirety; if all of the
that fails, then there's an error message.
- X: Exit point. Caption: If the program comment,
sans any leading or trailing "(something)", isn't empty and
contains no spaces, that's used as the caption;
otherwise, if the assembly-language instruction is
either TRA or HOP, then the operand
of the instruction is used if it can be interpreted as a
symbolic label; otherwise, "Line N" is used,
where N is the source-code line number.
- G: Go to. Caption: The assembly-language
instruction is expected to be a TRA or HOP
to a symbolic label, and that operand is used as the
caption.
|
|
P
|
Call to a subroutine or expansion of a
macro; i.e., a named sequence of instructions.
Caption: The program comment is generally of the
form "(label)remainder of comment", and is
used (word-wrapped) as the caption. If "(label)" is present, a
linefeed is also inserted following it.
|

|
M,
L, B, D
|
Unnamed sequence of
instructions. The caption is generated the same way as
for P (see above). The
distinction between M, L, B, and D isn't clear.
Perhaps the following interpretations, in order of
increasing uncertainty, are meaningful. Perhaps not:
- M: Mask
- L: switch seLector
- B: Begin, Bias, Backup, Bits, Burn, feedBack, oBtain,
time Base
- D: —\_(ツ)_/— (For future readers, if any, that's a
shrug emoji.)
Perhaps the real truth here is that there's no consistent
way for us to distinguish these annotations from each
other. The flowchart-generator software doesn't even
try, and treats them as interchangeable.
|

|
Q
|
Decision. The caption
is generated the same way as for P
(see above). |

|
I
|
Input or output, generally
via PIO instructions. The caption is
generated the same way as for P
(see above). |
|
A couple of red annotations relate to
the captions on arrows exiting a decision box rather then themselves
representing boxes:
Red
Annotation
|
Interpretation
|
Flowchart Shape
|
Y
|
Yes
|
|
N
|
No
|
|
And finally, there are various red
annotations in the original code that I haven't been able to discern
any purpose for, and are simply ignored by the flowchart-generator
software: E (perhaps "End of
routine"), $ (perhaps a comment), *, C (perhaps
"Completed").
There are also a few exceptional cases in which the flowchart
generator acts on the basis of the assembly-language code, even if
unmarked by red annotations:
- Any line with a symbolic label may potentially appear in the
flowchart as a TERMINAL box, captioned by the symbolic label
itself.
- Even without a symbolic label, any line may potentially appear
in the flowchart as a TERMINAL box if it's the target of a HOP,
TRA, TMI, or TNZ instruction.
Without a symbolic label, the TERMINAL box will be captioned as
"Line N", where N is the source-code line
number.
- Unannotated TRA instructions are treated as if they
were annotated by G.
- Unannotated TMI and TNZ instructions are
treated as if they were decision boxes (Q)
combined with uncaptioned exit arrows.
- Note: Unannotated HOP instructions are
not treated in any special way, since either P vs G
could be the appropriate annotation, and the flowchart generator
has no way to know which is which.
In most cases, the flowchart depicts control flow by following
the simple rule that each flowchart box has an arrow to the next
box, in the order that the annotations associated with the boxes
are encountered in the source code. But there are exceptions
that interrupt this simple default ordering:
- S boxes do not receive a default
arrow from the preceding box.
- Boxes do not receive a default arrow if the preceding box is
an X box, a G
box, or if the preceding LVDC instruction was TRA.
- And there are certain rare cases involving Q, Y,
and N in which there is no default arrow from the Q
box to the next box.
Decision boxes are the trickiest aspect of program flow in the
flowcharts. The stereotypical case is a two-way decision, in
which the pattern of LVDC instructions and flowchart annotations
looks like this:
... instructions
to set up a test ...
final instruction of
the setup
Q
TMI|TNZ label1
Y or N
next instruction
... additional
instructions ...
The flowchart associated with this has a decision box (labeled
with the comment for the "final instruction of the setup"), an
arrow captioned YES or NO to label1, and an arrow
captioned NO or YES to the next box following the decision
box. The complexity comes in because there are many ways to
do this differently or even wrong, and the flowchart generator
tries to handle as many of those exceptions as it can.
For one thing, suppose we instead had this:
... instructions
to set up a test ...
final instruction of
the setup
Q
TMI|TNZ label1
Y or N
TMI|TNZ label2
N or Y
next instruction
... additional
instructions ...
This is treated as a 3-way decision instead of a 2-way decision,
so that we have an arrow captioned YES or NO to label1,
and an arrow captioned NO or YES to label2, and an
uncaptioned arrow to the next box following the decision
box. Perhaps a bit misleading, but inescapable given that Y and N are
the only red annotations available
for the arrow captioning. (Fortunately, there seem to be no
4-way or higher decisions in LVDC code.)
A common situation, which may or may not be an error on the part
of the original programmer, is when the Q
annotation is missing:
... instructions
to set up a test ...
final instruction of
the setup
TMI|TNZ label1
Y or N
next instruction
... additional
instructions ...
In this case, the flowchart generator compensates by inserting a
decision box captioned by the comment associated with the TMI|TNZ
(not from the "final instruction of the setup"), but
otherwise proceeds as if the decision box had been present all
along; i.e., there is still an arrow from the decision box to label1,
and so on.
I probably haven't captured all of the possible aberrations
associated with decision-box annotations here, but the lesson is
clear: poorly-annotated decision-boxes are fairly common.
FLOW Directives
The FLOW directive is the mechanism provided to
compensate for poor flowchart annotations in the original source
code. A detailed worked-out example appears in the following
section.
When you want to correct poor flowchart annotations, the first
step is to determine what the correct annotations should
have been. However, having determined the correct
annotations, you can't simply modify the LVDC source code's
annotations, because our unalterable rule is that the LVDC source
code must match the original program listing exactly, even
if the original code was in error. Because otherwise, we
have no means of verifying that the transcription process was
correct. But we do allow additions to the source code of
directives defined only by the modern LVDC assembler and not
accepted by the original LVDC assembler, because there's no way of
confusing such a directive with incorrectly-transcribed source
code.
The FLOW directive is one such modern-only addition to
LVDC assembly language. The FLOW directive is
placed on the line immediately preceding a line with poor
flowchart annotations, and provides corrections to those
annotations. However, the FLOW directive is used
only by the flowchart generator program, and is entirely discarded
by the modern LVDC assembler, so that the presence of FLOW
directives does not in any way alter assembled LVDC code.
From the description in the preceding section, you'll have noted
that the following characteristics of a line of LVDC code
sometimes affect flowchart generation:
- The red annotation.
- The symbolic label of the line.
- The LVDC instruction.
- The operand of the LVDC instruction.
- (Intentionally blank; relates to a property of full-line
comments that's no longer used).
- The "label" in a comment
of the form "(label)remainder of comment".
- The "remainder of comment" in a
comment of either the form "(label)remainder of comment" or "remainder of comment".
The FLOW directive has 7 fields corresponding to these
parameters (including the always-blank #5), and allows you to
correct any or all of them for any given line of LVDC code.
The format of a FLOW-directive line is:
FLOW F1,F2,F3,F4,F5,F6,F7
where the fields F1 and so on correspond to the 7 characteristics
mentioned above. Note that there are no spaces shown.
In fact, no spaces are allowed until F7 is reached, since F7 is
the only one of the seven fields that can actually contain any
spaces. Any field you don't want to provide a
correction for is left empty. For example, the directive
FLOW ,,,,,,
would correct nothing at all. If the correction you want to
apply is to blank out something that isn't empty already, you can
use the field ""; i.e., two double-quotes side-by-side. Thus
the following command would blank out all seven flowchart
characteristics:
FLOW "","","","","","",""
The most-common use of FLOW is probably to change the red annotation. For example, here is
a directive to turn a line into a decision box and provide a caption
for it that differs from what's on the source-code line:
FLOW Q,,,,,,MY DECISION?
There are also a couple of new red
annotations you can use, invented solely for the modern assembler
and not present in original LVDC code. They're intended mostly
for internal use by the flowchart generator, but can sometimes be
used to good effect in FLOW directives:
- ? indicates a decision box, and
at the same time an uncaptioned exit arrow from the box.
It's like a Y or N unaccompanied by a preceding Q (as described above) but without any
caption on the arrow.
- - is used for marking lines
that have a symbolic label but are otherwise without flowchart
annotations.
For example, suppose you had code like so,
       TMI     *+1
       TRA     label
       ... some instruction ...
The TMI instruction will turn into a decision box and will want
to have an arrow to "some instruction", but "some instruction" has
no symbolic label, and thus the flowchart generator will want to
insert a terminal box with a caption like "Line N".
But if you instead inserted a FLOW directive,
       TMI     *+1
       TRA     label
       FLOW    -,MYLABL,,,,,
       ... some instruction ...
it would instead insert a terminal box captioned "MYLABL" ... which
may or may not be more meaningful than "Line N". (It's
just an example!)
Working Example: the SQUARE ROOT
UTILITY Module of AS-512
.dot.ps.png) What I'd like to
do in this section is work through a real-life example, namely
that of the SQUARE ROOT UTILITY module from the AS-512 flight
program that has already been used several times above as an
example. It's a very short file that has a relatively-large
number of potential improvements. Fixing it up the flowchart
will thus be a lot of work, but at the same time we'll gain a lot
of understanding about the code along the way.
What I'd like to
do in this section is work through a real-life example, namely
that of the SQUARE ROOT UTILITY module from the AS-512 flight
program that has already been used several times above as an
example. It's a very short file that has a relatively-large
number of potential improvements. Fixing it up the flowchart
will thus be a lot of work, but at the same time we'll gain a lot
of understanding about the code along the way.
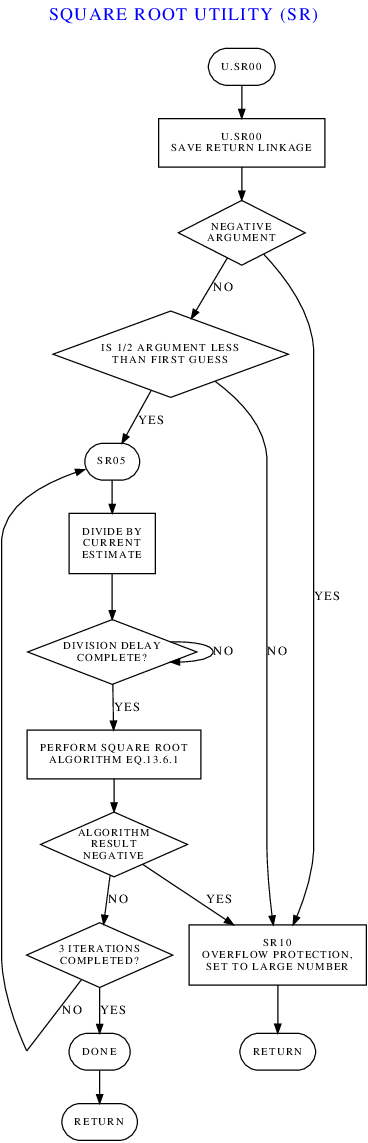
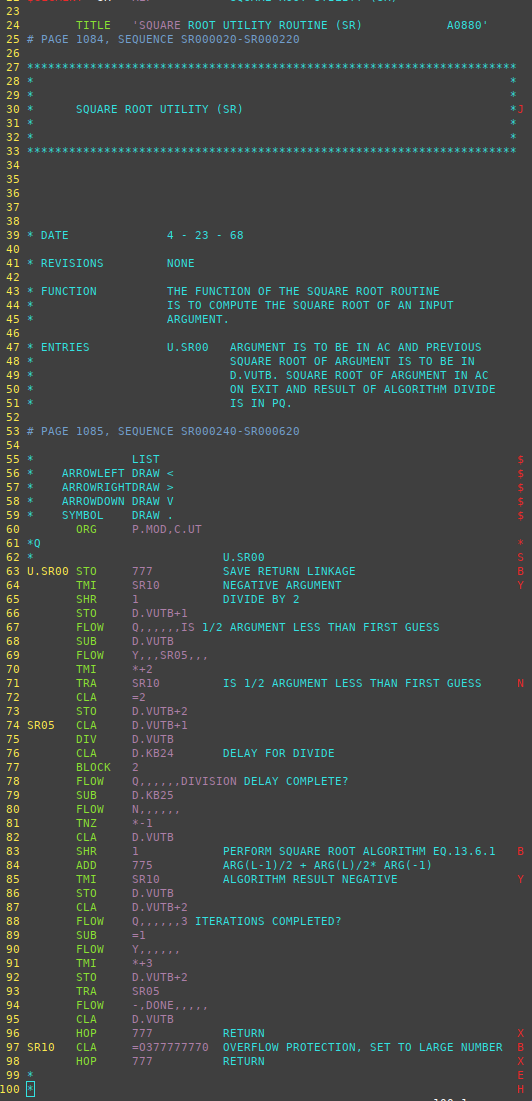
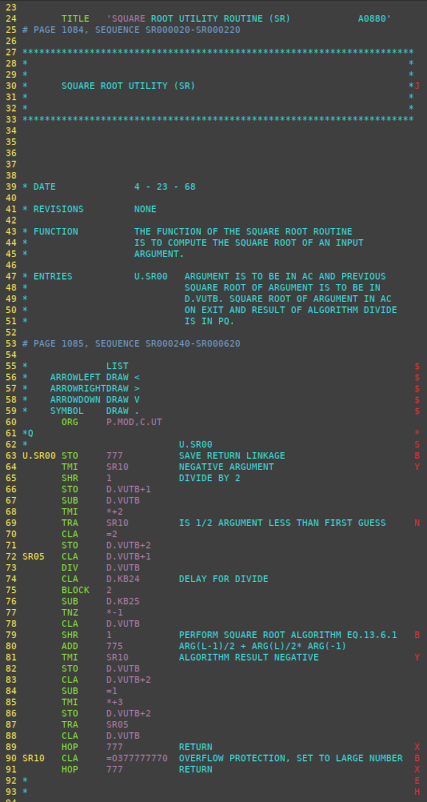
To the left is the relevant portion of the source-code file,
which I've chosen to look at using the vim editor, because LVDC
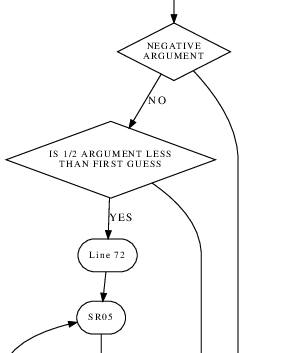
syntax-highlighting is available in vim. Whereas to the
right we see the flowchart generated from that source code as-is.
As mentioned earlier, one issue with the flowchart is that we may
have succeeded in accurately reproducing the program flow — that
remains to be seen! — but inadequate flowcharting annotations in
the original source code may not have allowed decent labeling of
some of the boxes or arrows in the flowchart. You can see
this particularly in the decision boxes labeled "Line 68", "Line
77", and "Line 85", and in the associated entry points labeled
"Line 70", "Line 76", and "Line 88". Why these goofy
labels? It's because there's nothing in the source code that
tells the flowchart-generator software anything meaningful about
the test being performed or the significance of the test
results.
So if we want to fix up the flowchart at those points with meaningful
captions, we have to use our soft human brains to figure out the intent
of the original source code. This will require actual
thinking and rummaging around in the LVDC source code, and cannot
be done in some formulaic rote fashion.
Let's first see if we can figure out what's happening at line 68
of the source code and its environs. According to the
comments at the top of the source code, subroutine U.SR00
accepts a number (let's call it x) in the accumulator
register and is supposed to compute its square root. D.VUTB
(a variable), it tells us, contains the "previous square root of
argument". So presumably one would load an initial guess for
the square root (perhaps x/2) into D.VUTB before
calling U.SR00 the first time, and could then keep
calling U.SR00 iteratively in order to keep refining the
square-root value.
It's too bad that the comments in the source code don't actually
say that, and instead force us to presume it.
As it happens, there is external documentation that can help us
out somewhat, sometimes, in figuring out stuff like this.
The external documentation I speak of is something called the
Equation Defining Document (EDD). Unfortunately, there are
several separate EDDs, and we only have the one called "LVDC
Equation Defining Document (EDD) for the Saturn IB Flight
Program". Which is not what the AS-512 flight
program is, given that AS-512 used a Saturn V launch
vehicle. But still, it's close enough in some ways to be
helpful. Rather than making you look in the document library
for the document, here are direct links to the various parts of
that EDD:
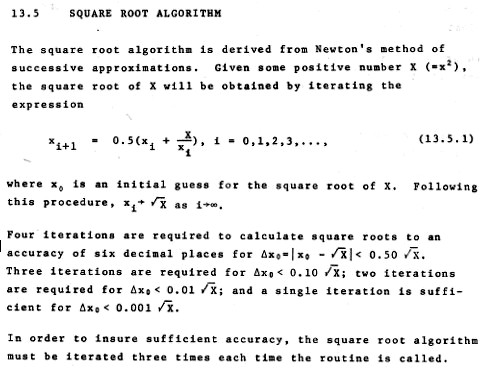
Now, if you look at line 79 in the source code, you'll notice a
reference to EQ. 13.6.1. That's an equation in the EDD,
though since we have a different version of the EDD, it's not
necessarily the same equation number. As it happens, in the
Saturn IB EDD it's section 13.5 (rather than 13.6) that describes
SQUARE ROOT ALGORITHM, so the relevant equation is 13.5.1.
Let me quote the EDD in full:
With that explanation, it now becomes clear that the test being
performed at line 68 is whether or not x/2 is less than the
estimated root, D.VUTB. Which not coincidentally, is
what the comment for next line, line 69, says. Thus if
lines 67-69 of the source code had been annotated properly
for flowcharting, they should instead read:
       SUB     D.VUTB       IS 1/2 ARGUMENT LESS THAN FIRST GUESS     Q
       TMI     *+2                                                    Y
       TRA     SR10                                                   N
 But what are we going to do about
it? Our own rules for transcribing the LVDC source code are to
do so as-is, including all errors, so we can't just go in
and "fix" the program comments according to how we imagine they
should have been done way back when. What we do instead is to
add FLOW directives, which don't exist in the original
LVDC assembly language, and thus are unambiguously "modern", without
changing any of the original lines. Here's what that looks
like:
But what are we going to do about
it? Our own rules for transcribing the LVDC source code are to
do so as-is, including all errors, so we can't just go in
and "fix" the program comments according to how we imagine they
should have been done way back when. What we do instead is to
add FLOW directives, which don't exist in the original
LVDC assembly language, and thus are unambiguously "modern", without
changing any of the original lines. Here's what that looks
like:
       FLOW    Q,,,,,,IS 1/2 ARGUMENT LESS THAN FIRST GUESS
       SUB     D.VUTB
       FLOW    Y,,,,,,
       TMI     *+2
       TRA     SR10         IS 1/2 ARGUMENT LESS THAN FIRST GUESS     N
I could have added a FLOW directive here to remove the
comment from line 69, but there's no need to do so, since that
comment never shows up the flowchart. But regardless, the
section of the flowchart related to Line 68 and its environs has now
changed to the more-pleasant form seen at left.
Although the decision box for line 68 has been fixed, the entry
point formerly labeled "Line 70" (but now "Line 72" because of the
addition of the two FLOW directives) has not. The
problem is that the TMI *+2 (formerly at line 68 but now
at line 70) jumps to *+2, but there's no symbolic label at
*+2. The flowchart generator makes up its own label
for *+2 ... namely, "Line 72". But if you look at
what happens after reaching "Line 72", the code simply progresses
straight to SR05 with no intervening annotations or even
program comments: i.e., with nothing relevant to the flowchart
in between. So as far as the flowchart is concerned, instead
of TMI *+2 it may as well have been TMI SR05.
Let's change the FLOW directive we already added to have that effect:
       FLOW    Y,,,SR05,,,
       TMI     *+2
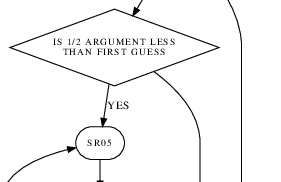 Remember, FLOW directives do
not affect the assembly of the source code in any way, so TMI
*+2 still assembles as TMI *+2 regardless of any FLOW
directives we may choose to stick in front. The result of this
change, seen to the right, is exactly what we desired.
Remember, FLOW directives do
not affect the assembly of the source code in any way, so TMI
*+2 still assembles as TMI *+2 regardless of any FLOW
directives we may choose to stick in front. The result of this
change, seen to the right, is exactly what we desired.
The next problems to be addressed are at the original lines 76 and
77, but which are now lines 78 and 79 due to the addition of FLOW
directives in the meantime. It's tiring talking about all of
these changing line numbers, so from now on whenever I mention a
line number, it will always be from the original source code
and flowchart, sans FLOW directives.
Aside: Here's a pro tip for
you. Fix the flowcharting problems from the bottom
of the source-code file upward. That way, addition
of FLOW directives doesn't keep messing up the line numbers!
Original lines 76 and 77 apparently constitute some kind of delay
loop, starting with a count of D.KB24, and then
decrementing that count by D.KB25 until it becomes
negative. Not that it really matters what the specific values
of D.KB24 and D.KB25 are, but looking at where
they're allocated in the GFP DATA PACK module, we find that they're
4 and 2, respectively ... so it's actually a very short delay
indeed. At any rate, the code originally looks like this,
       SUB     D.KB25
       TNZ     *-1
       CLA     D.VUTB
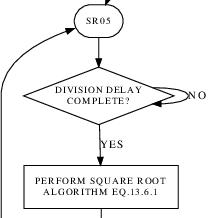
but it seems as though we should update it to:
       FLOW    Q,,,,,,DIVISION DELAY COMPLETE?
       SUB     D.KB25
       FLOW    N,,,,,,
       TNZ     *-1
       CLA     D.VUTB
which indeed repairs it as shown to the left.
Now let's look at the problems related to (original) lines 85 and
88. Back at (original) line 71, a value of 2 was stored in the
variable D.VUTB+2. What's happening near line 85 is
that D.VUTB+2 is decremented by 1, and jumps back to SR05
as long as D.VUTB+2 doesn't become negative. In
other words, SR05 is the start of a loop, D.VUTB+2
is the loop counter, and the loop is executed 3 times, for D.VUTB+2
equal to 2, 1, and then 0. So it seems as though we need the
following FLOW directives at (original) lines 84 and 85:
       FLOW    Q,,,,,,3 ITERATIONS COMPLETED?
       SUB     =1
       FLOW    Y,,,,,,
       TMI     *+3
       STO     D.VUTB+2
       TRA     SR05
       FLOW    -,DONE,,,,,
       CLA     D.VUTB
The mysterious "FLOW -,DONE,,,,," near the bottom is there
to provide a label ("DONE") to which the decision box can
exit, since otherwise it would exit to the (unlabeled) "Line something".
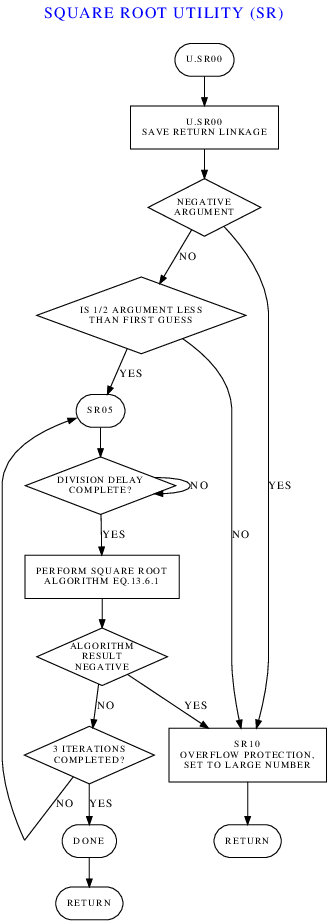
Putting this all together, we end up with the following pepped-up
source code and flowchart for it:
Once these things are in hand, the next step is to compare them to
see whether or not the flowchart accurately and usefully reflects
what the source code is doing? Since we're only looking about
about a page of relatively-simple code here, it's pretty easy to do
that without a lot of yakety yak from me. The "DONE" entry
point in the flowchart looks a bit weird, since there's no actual
label "DONE" in the source code, but I don't know what can be done
about that, if anything. About the only other obvious thing is
to wonder where the division referenced by the "DIVISION DELAY
COMPLETE?" decision box is? Thus one might want to add a FLOW
directive such as
FLOW B,,,,,,DIVIDE BY CURRENT ESTIMATE
at (current) line 75 so that the DIV operation shows up in
the flowchart. The final, final version of the
flowchart, unless I or somebody else keeps thinking about it, thus
becomes:
← Before vs After →